Honeywell Optimizer Supervisor + Energy Manager for climate-neutral buildings
Optimise the energy consumption of your buildings
Use the Energy Manager add-on to the Honeywell Optimizer Supervisor to automatically record, analyse, log and visualise the energy use of all consumers in your buildings. Energy utilisation and efficiency are depicted clearly and comprehensibly in visually appealing graphs and charts, providing you with essential leverage to achieve significant energy and cost savings.
Powerful functions in detail
Benchmarking
- Compare energy profiles (daily, weekly, monthly values)
- Create consumer rankings
- Bar charts for detailed insights
- Segmented property view to identify outliers
- Aggregated consumer rankings for deeper insights
- Detect and rectify anomalies and inefficiencies in a targeted manner
Energy benchmarking View the energy profile of your buildings and compare the current daily, weekly and monthly values with those of the previous reporting period and the previous year. |
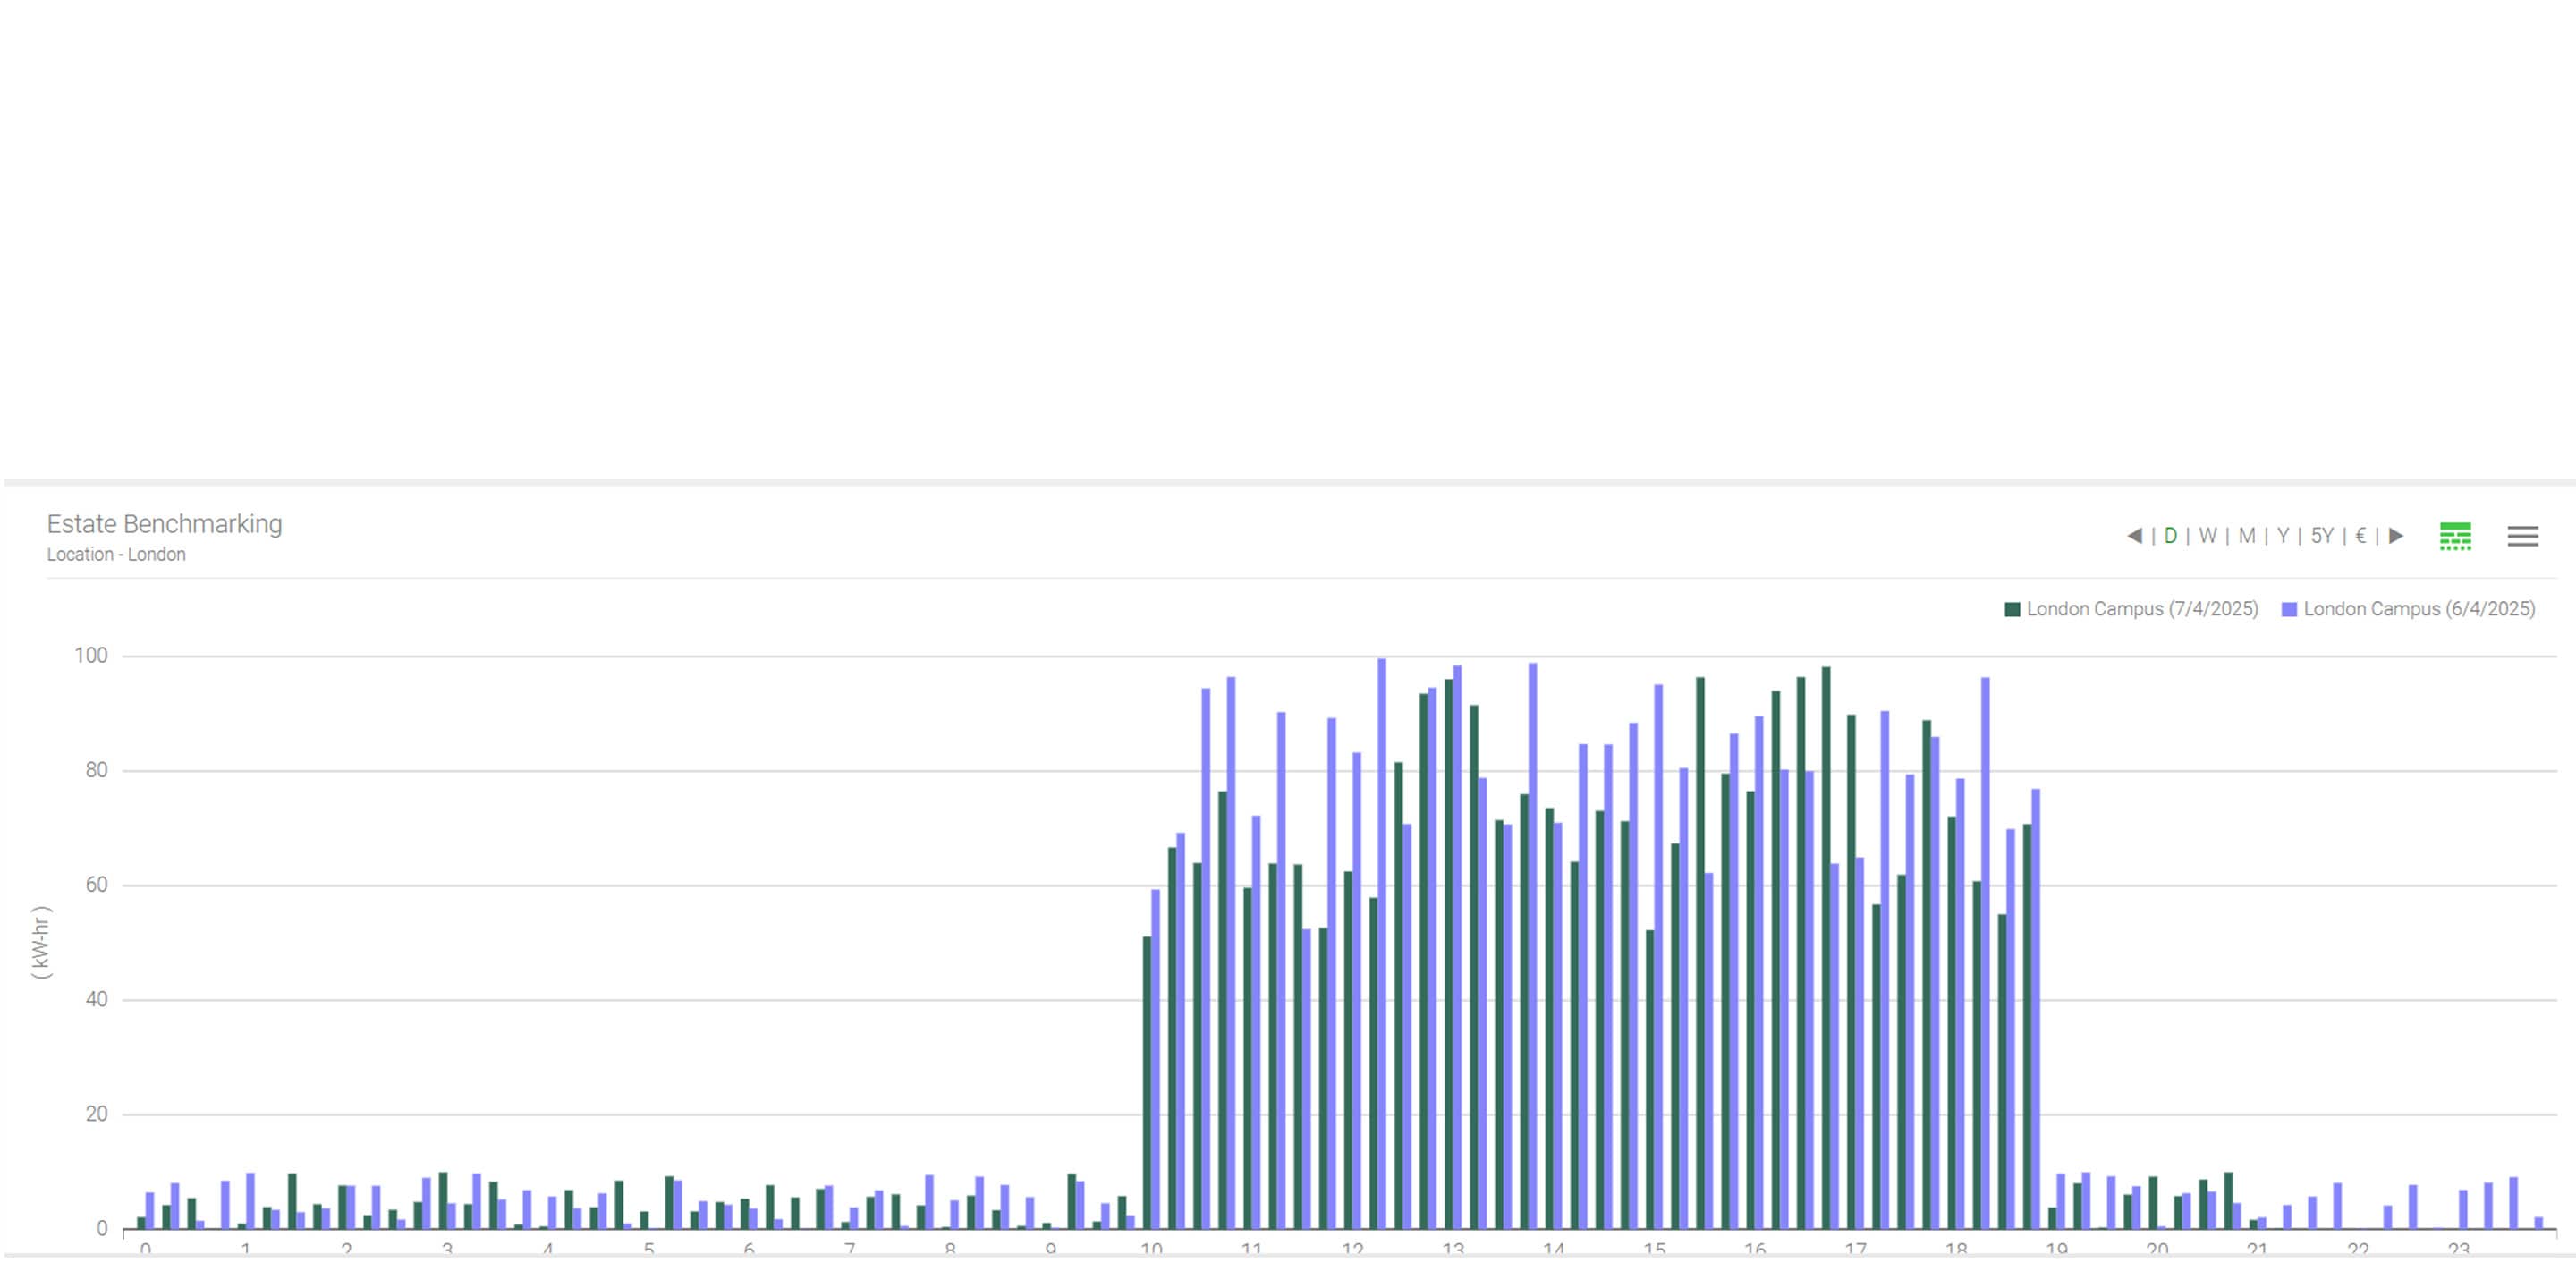 |
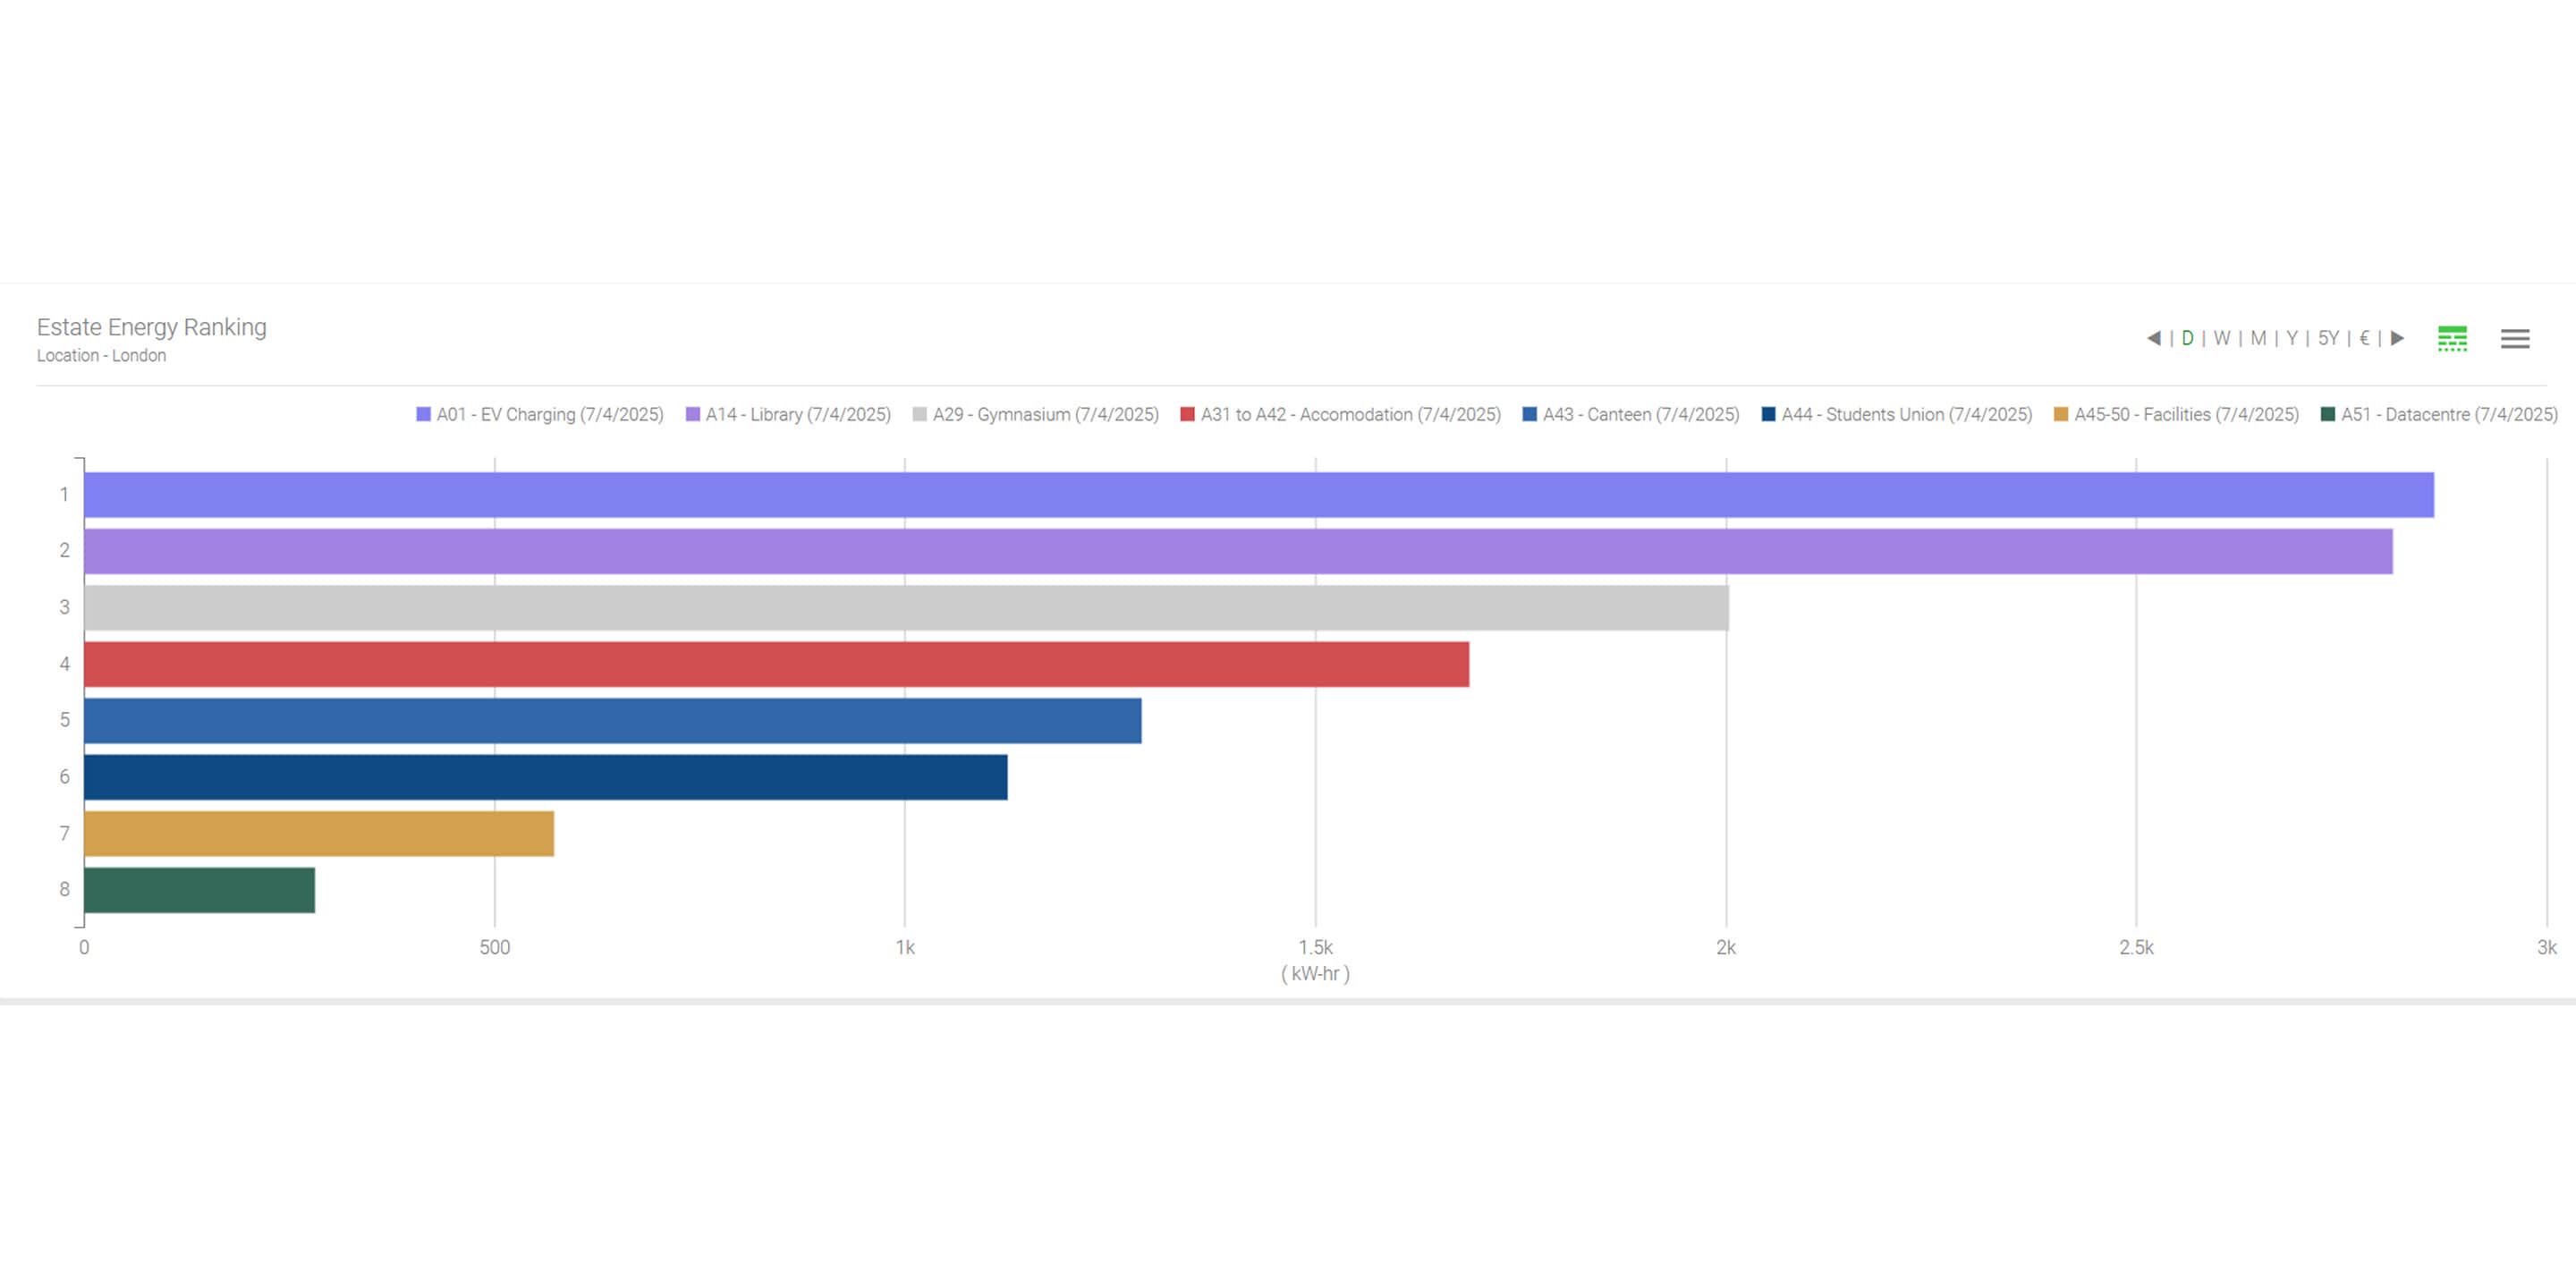 |
Energy ranking Compare the largest and smallest consumers within a group of meters, floors, zones or buildings and show or hide individual consumers. |
Extended bar charts See a breakdown of the individual consumers and understand how they contribute to your daily energy consumption. |
 |
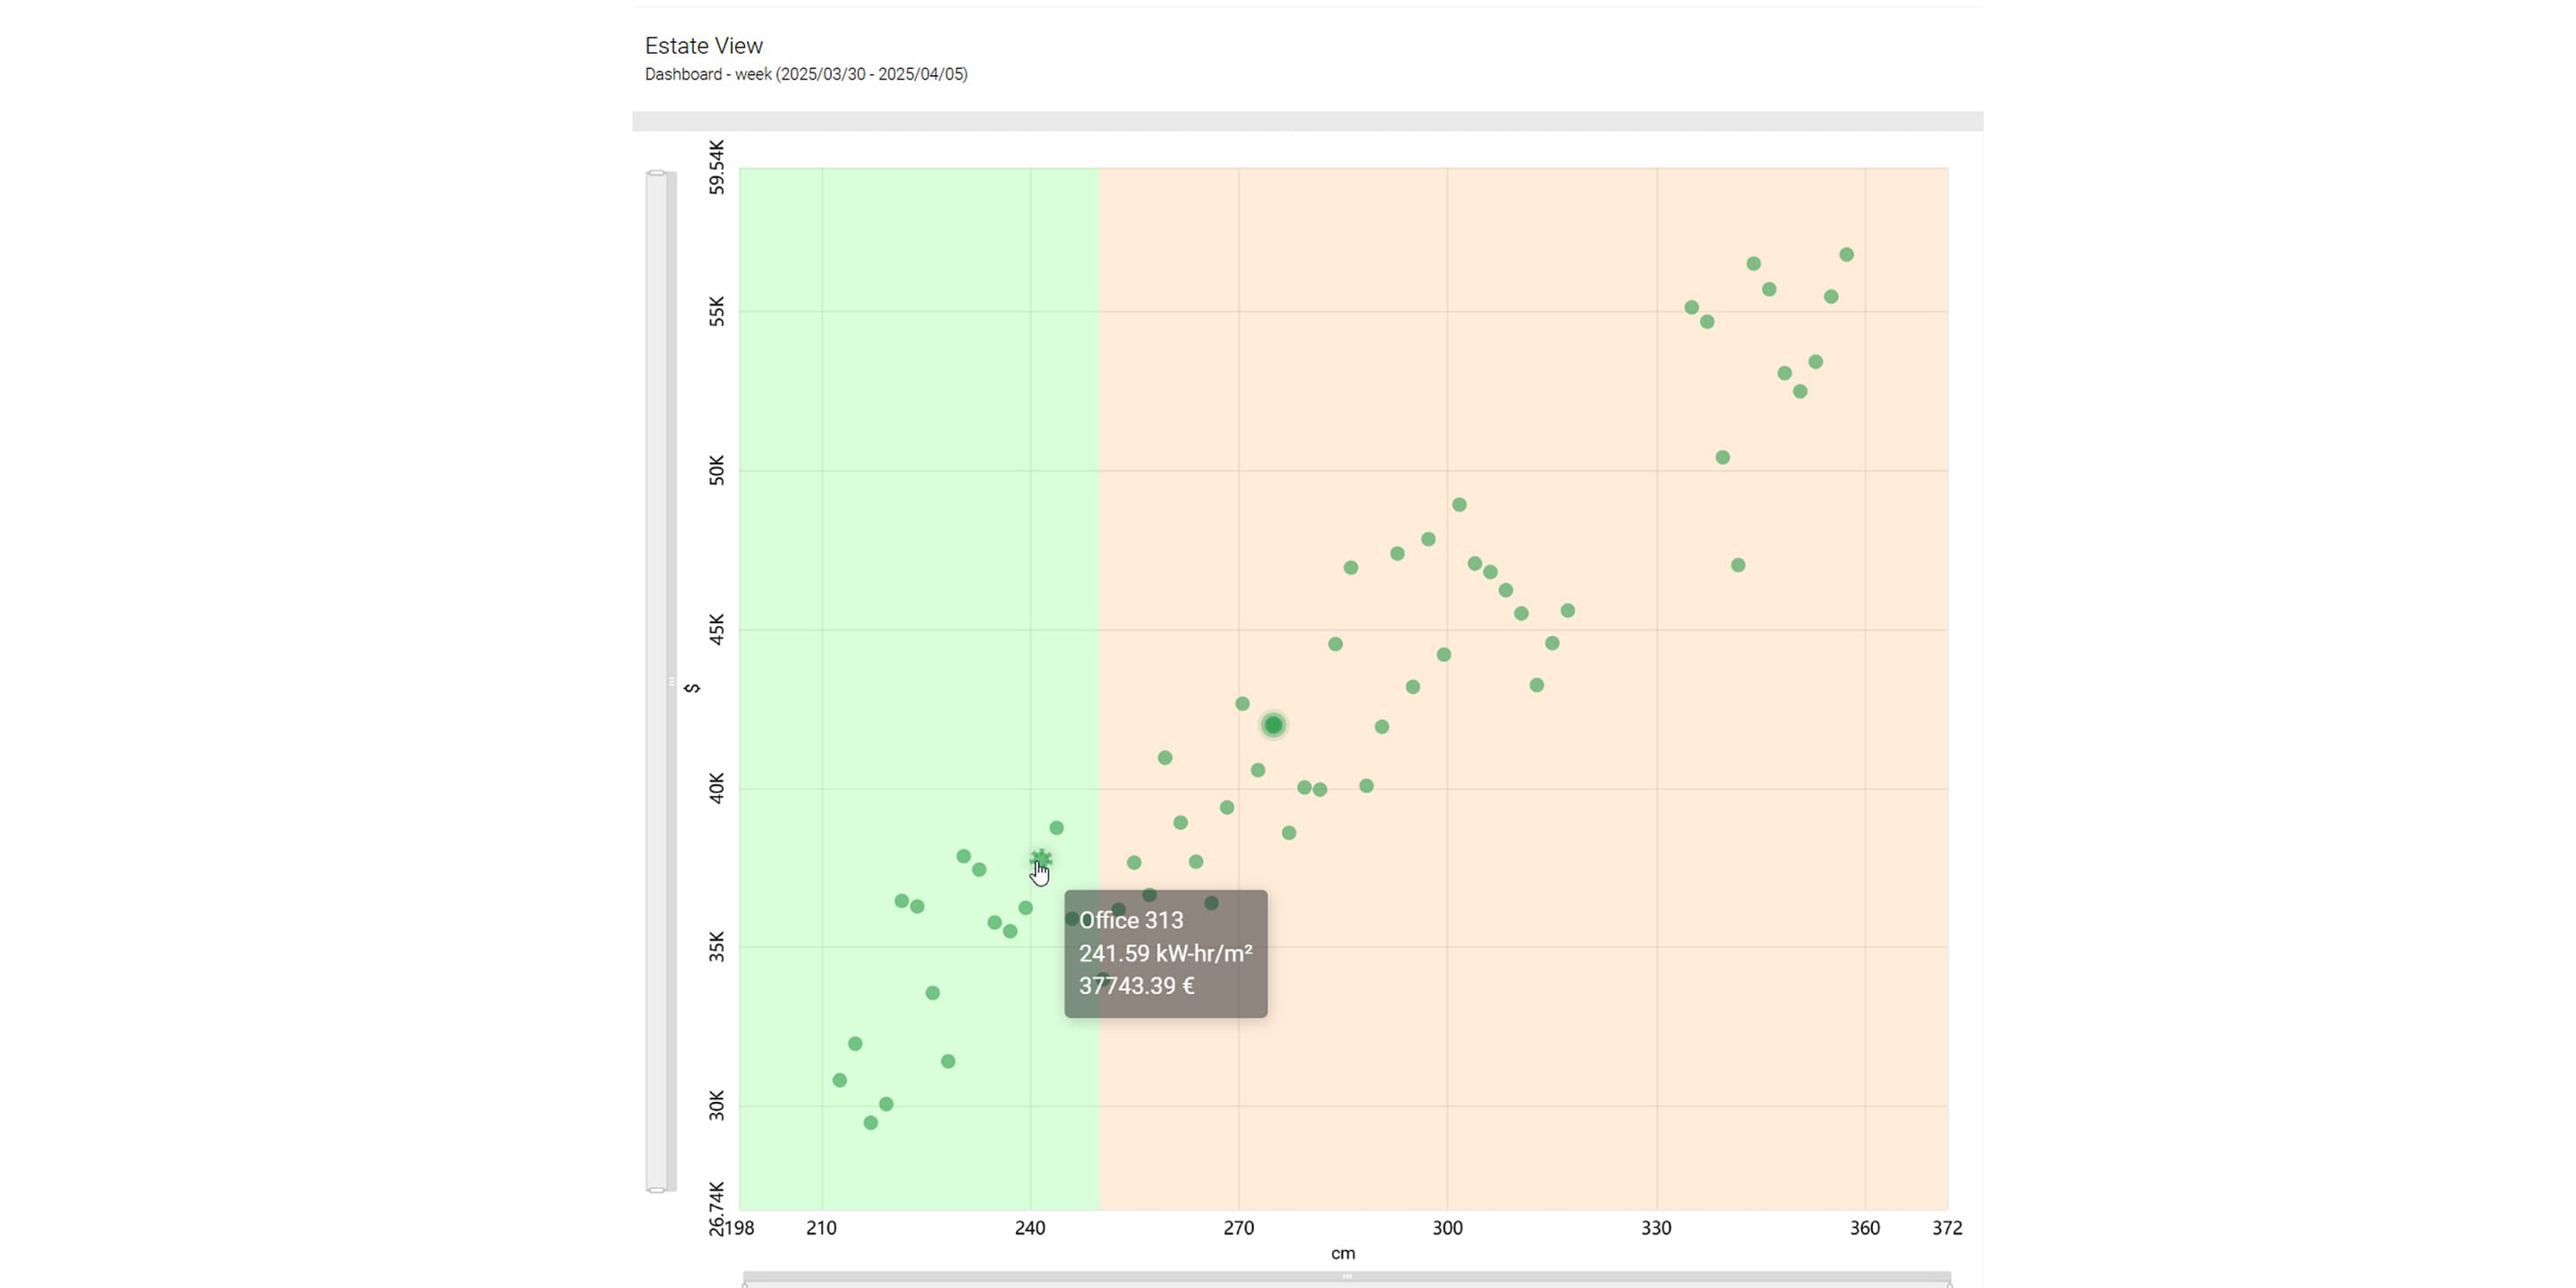 |
Estate view This view segments the entire property into quadrants and uses normalisation techniques to output key figures. By displaying energy consumption on the x-axis and costs on the y-axis, you can identify and specifically analyse outliers with high energy consumption and high costs. |
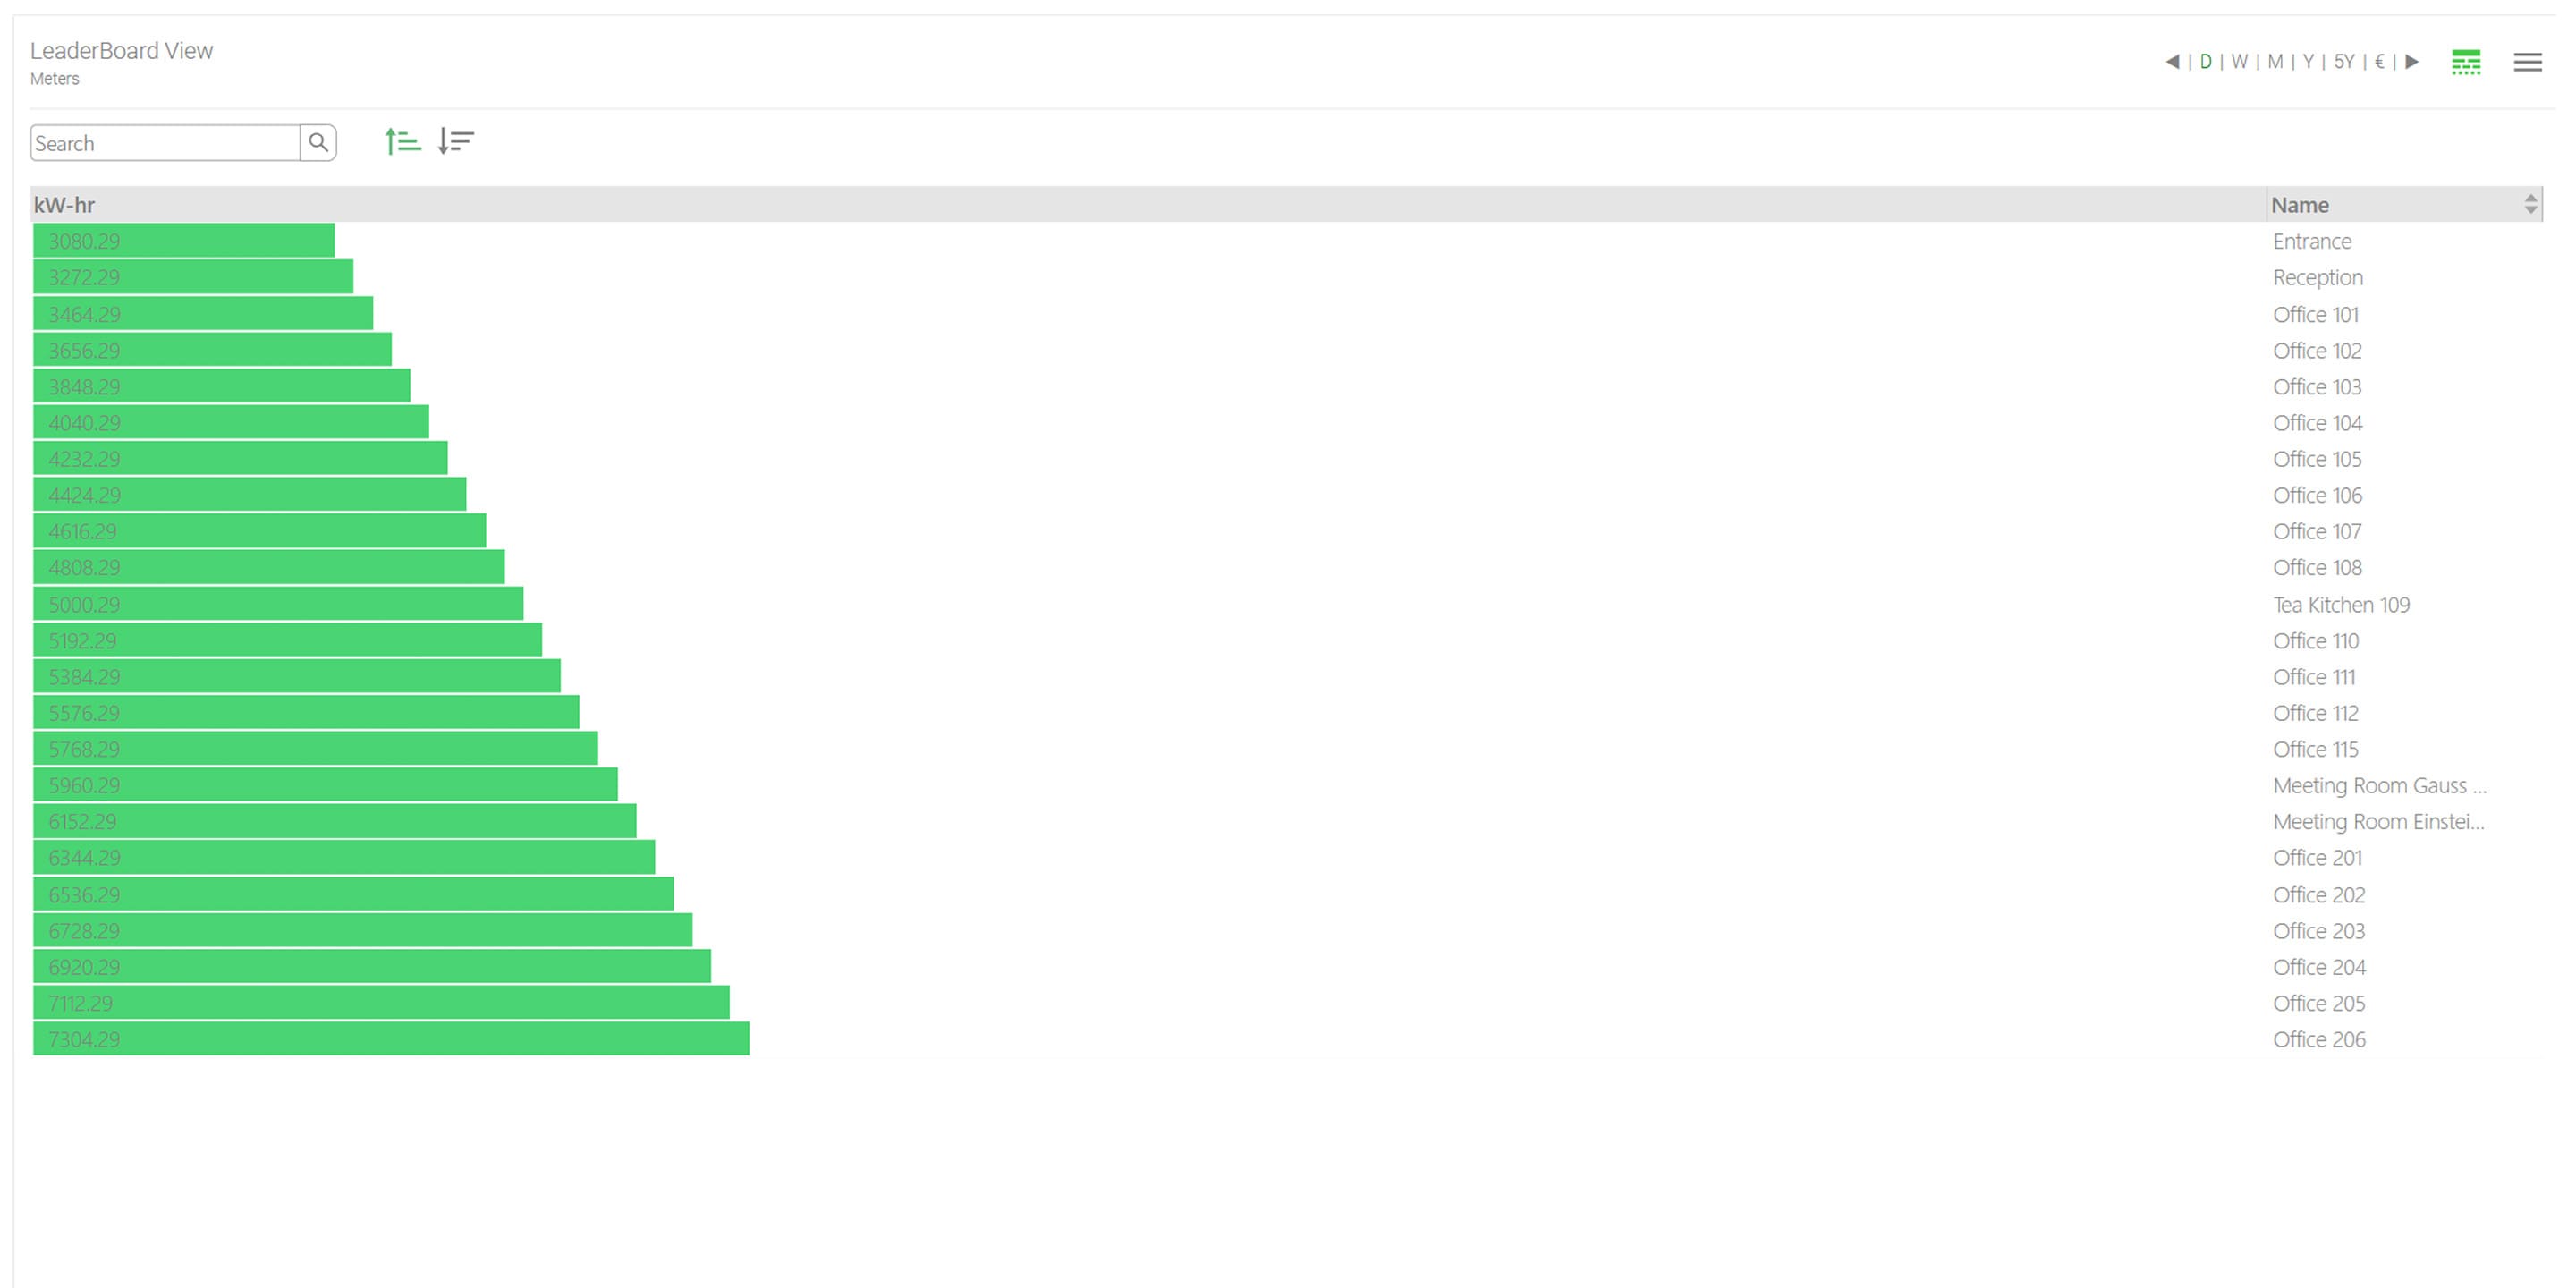
Leaderboard chart The leaderboard chart is a visualisation tool that complements conventional ranking charts by displaying aggregated results as labelled horizontal bars. Optional columns for time periods and percentages provide deeper insights. |
 |
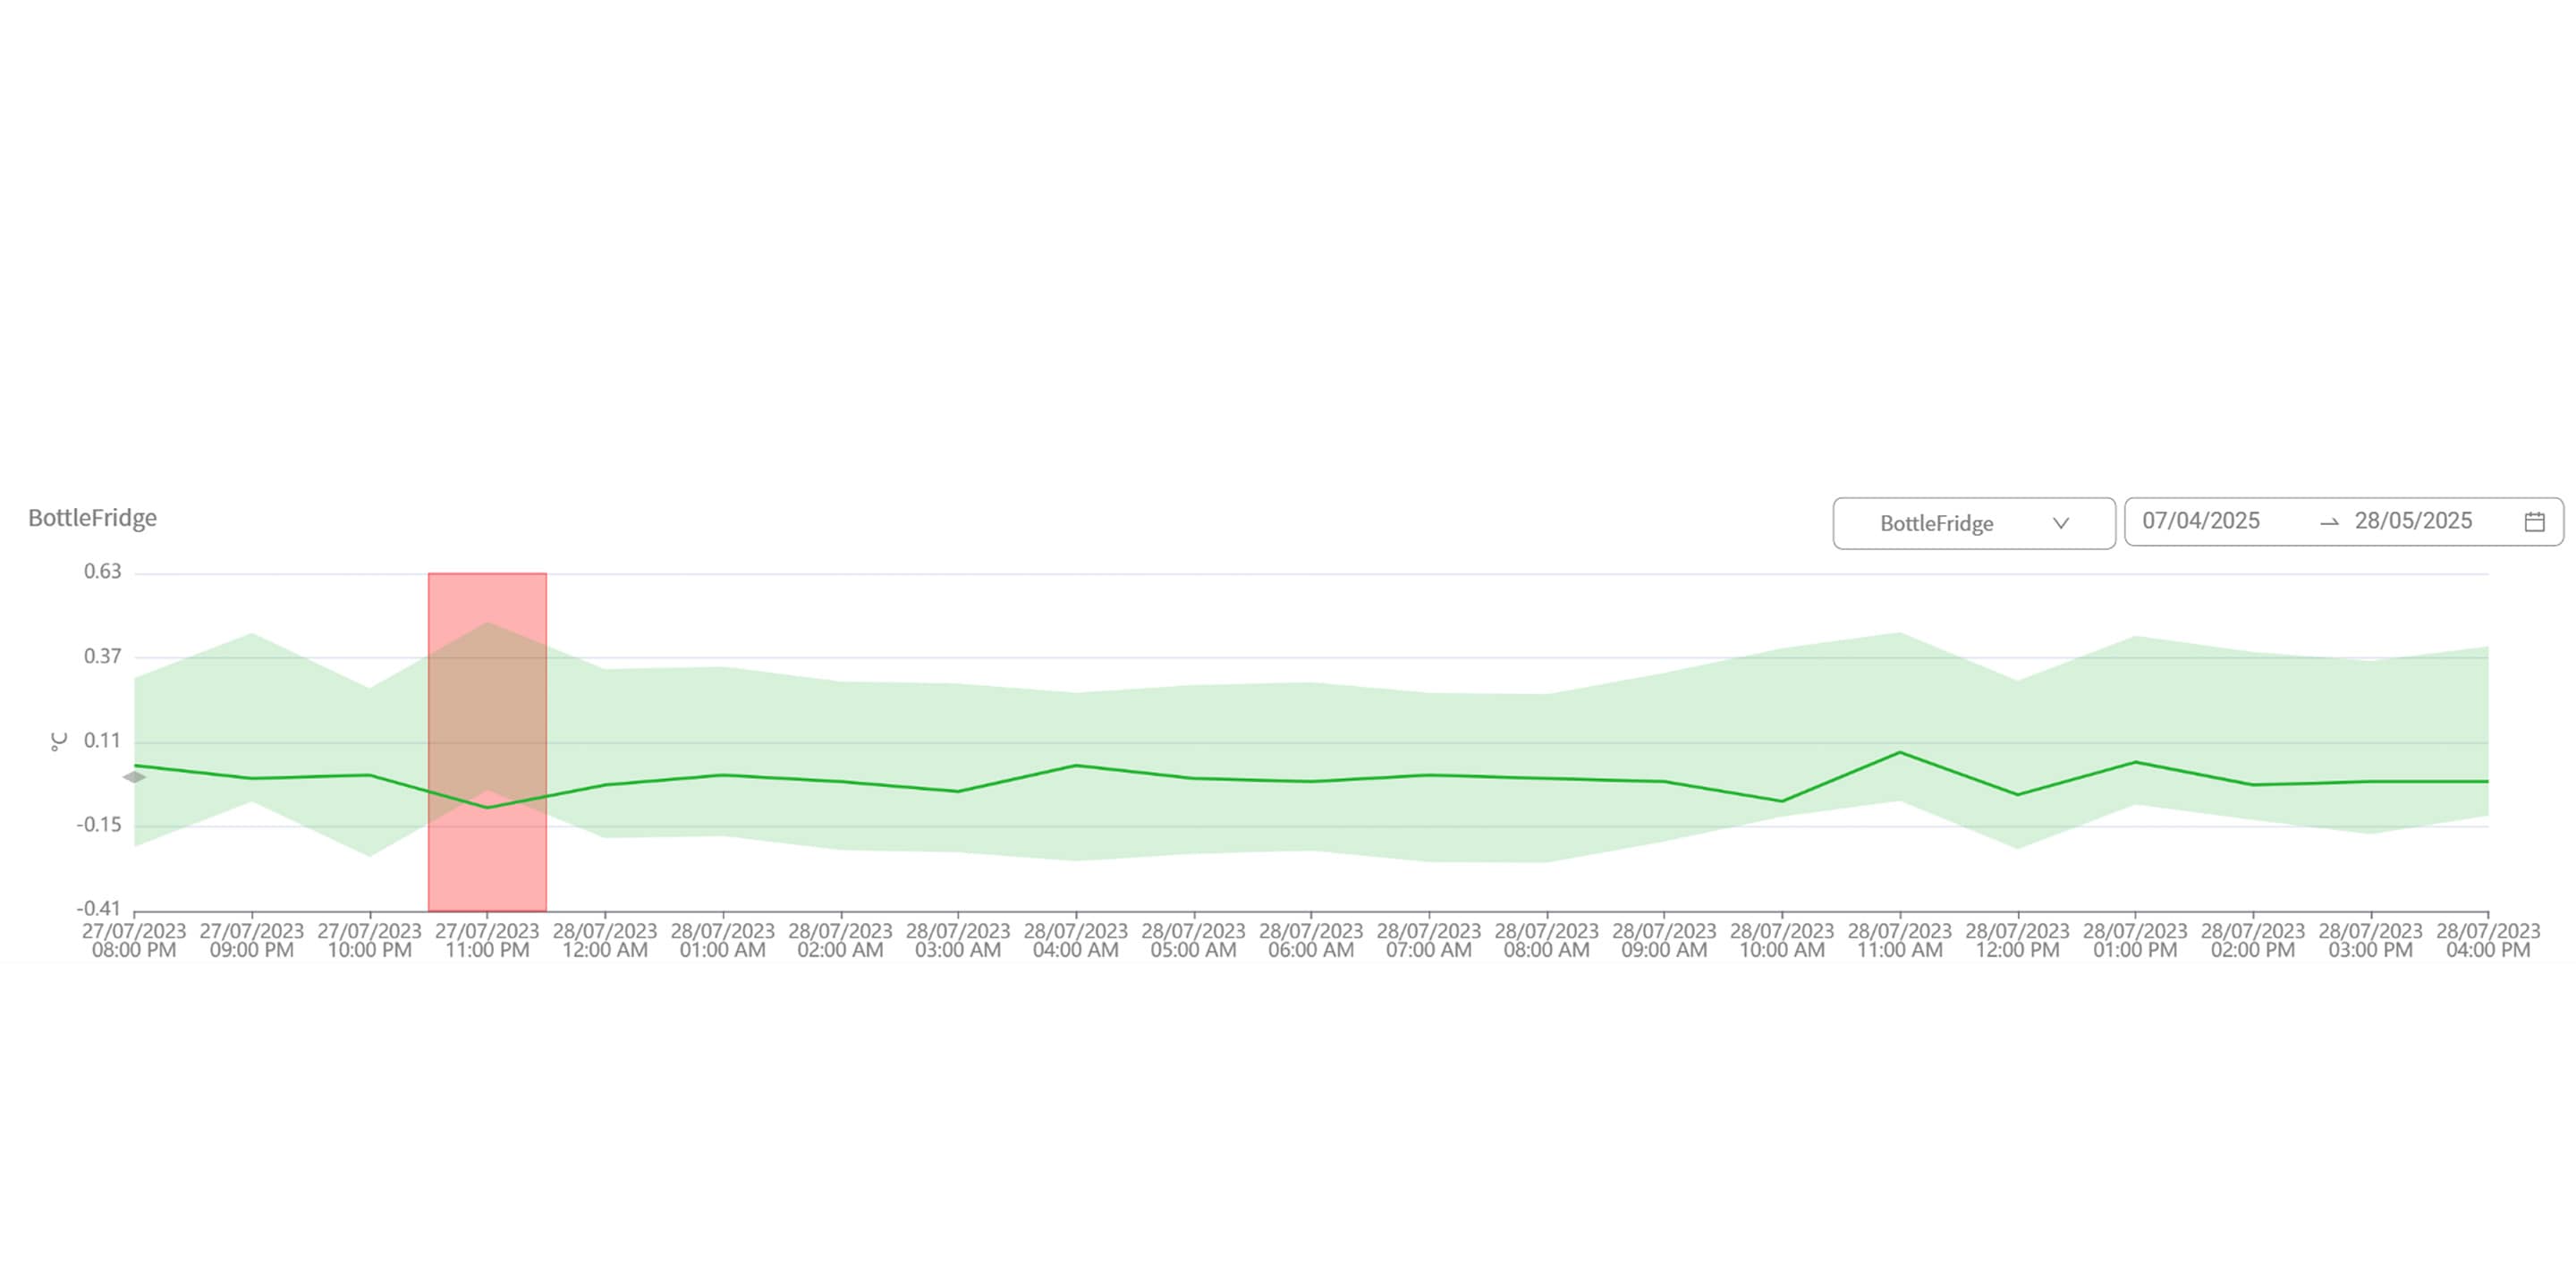 |
Anomaly detection This innovative function identifies unusual energy utilisation patterns with impressive precision. By automatically detecting anomalies and potential inefficiencies, you can take targeted action to optimise energy consumption across multiple sites, thereby improving the overall performance of your buildings and reducing operating costs. |
Analysis
- Visualise the relationship between weather data and energy consumption
- Identify main consumers
- Recognise trends and outliers at a glance
- Perform automated analyses and precise predictions with AI
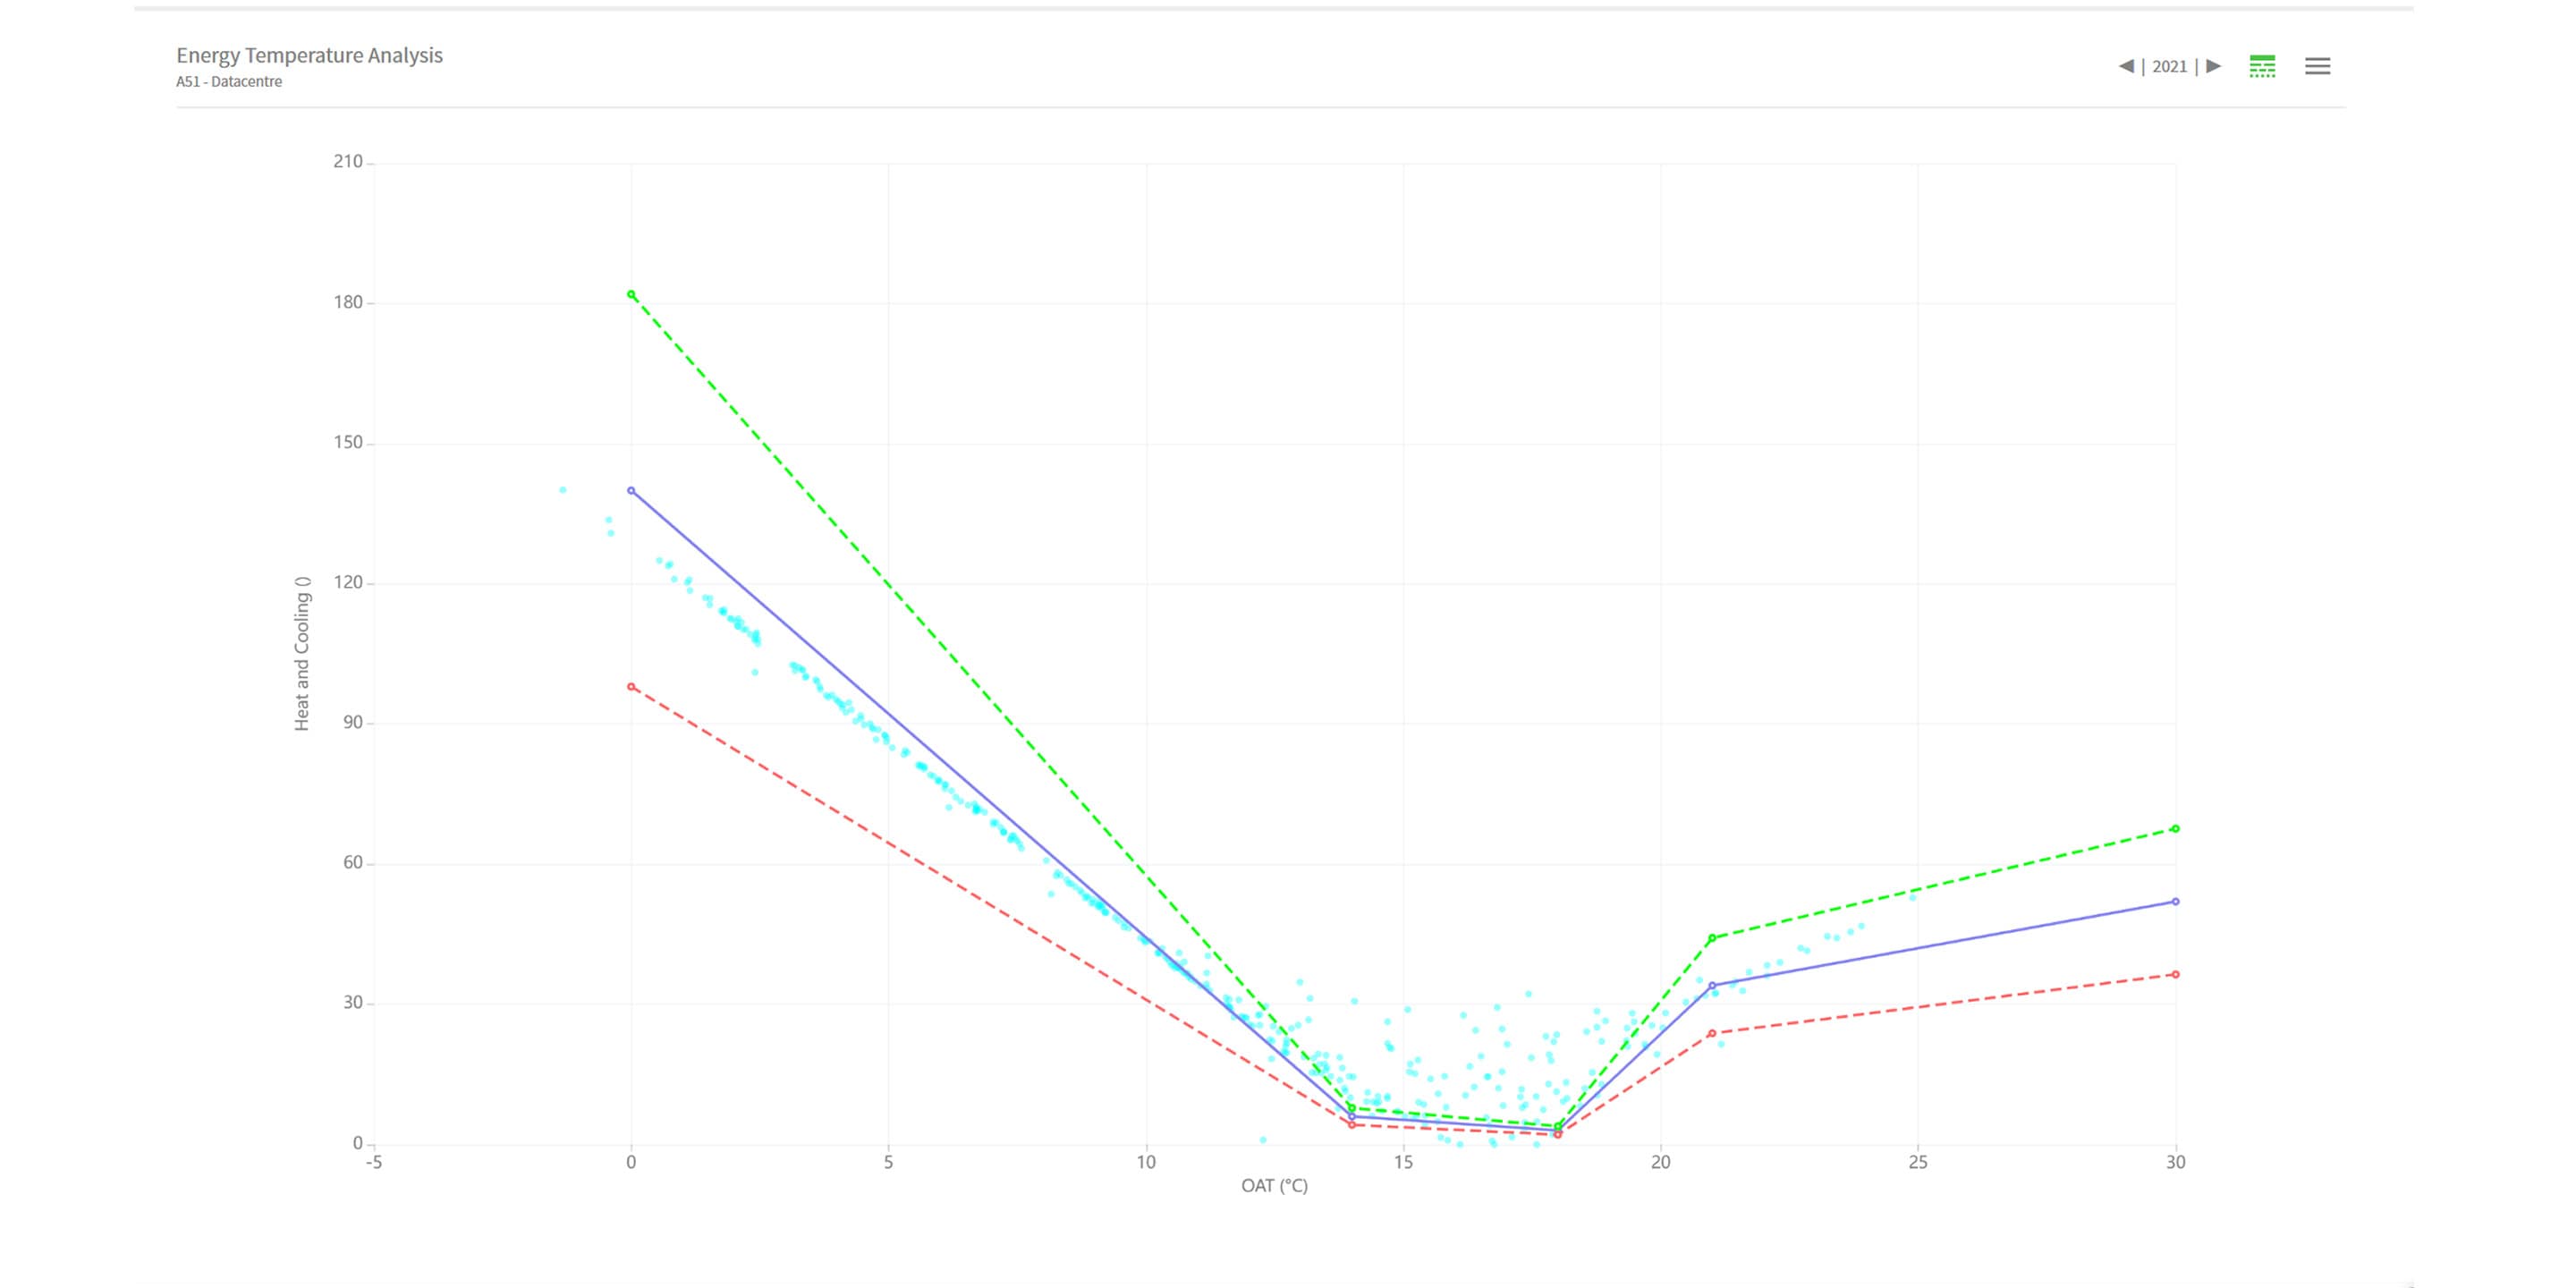
Energy temperature curve Visualise the effects of the outside temperature on the energy consumption of your building over the course of a year. You can then define the ideal consumption for different temperature ranges and tolerance values. |
 |
 |
Identify consumption trends Use easily configurable pie charts to discover how specific buildings or zones contribute to your total energy costs and your overall energy consumption.
|
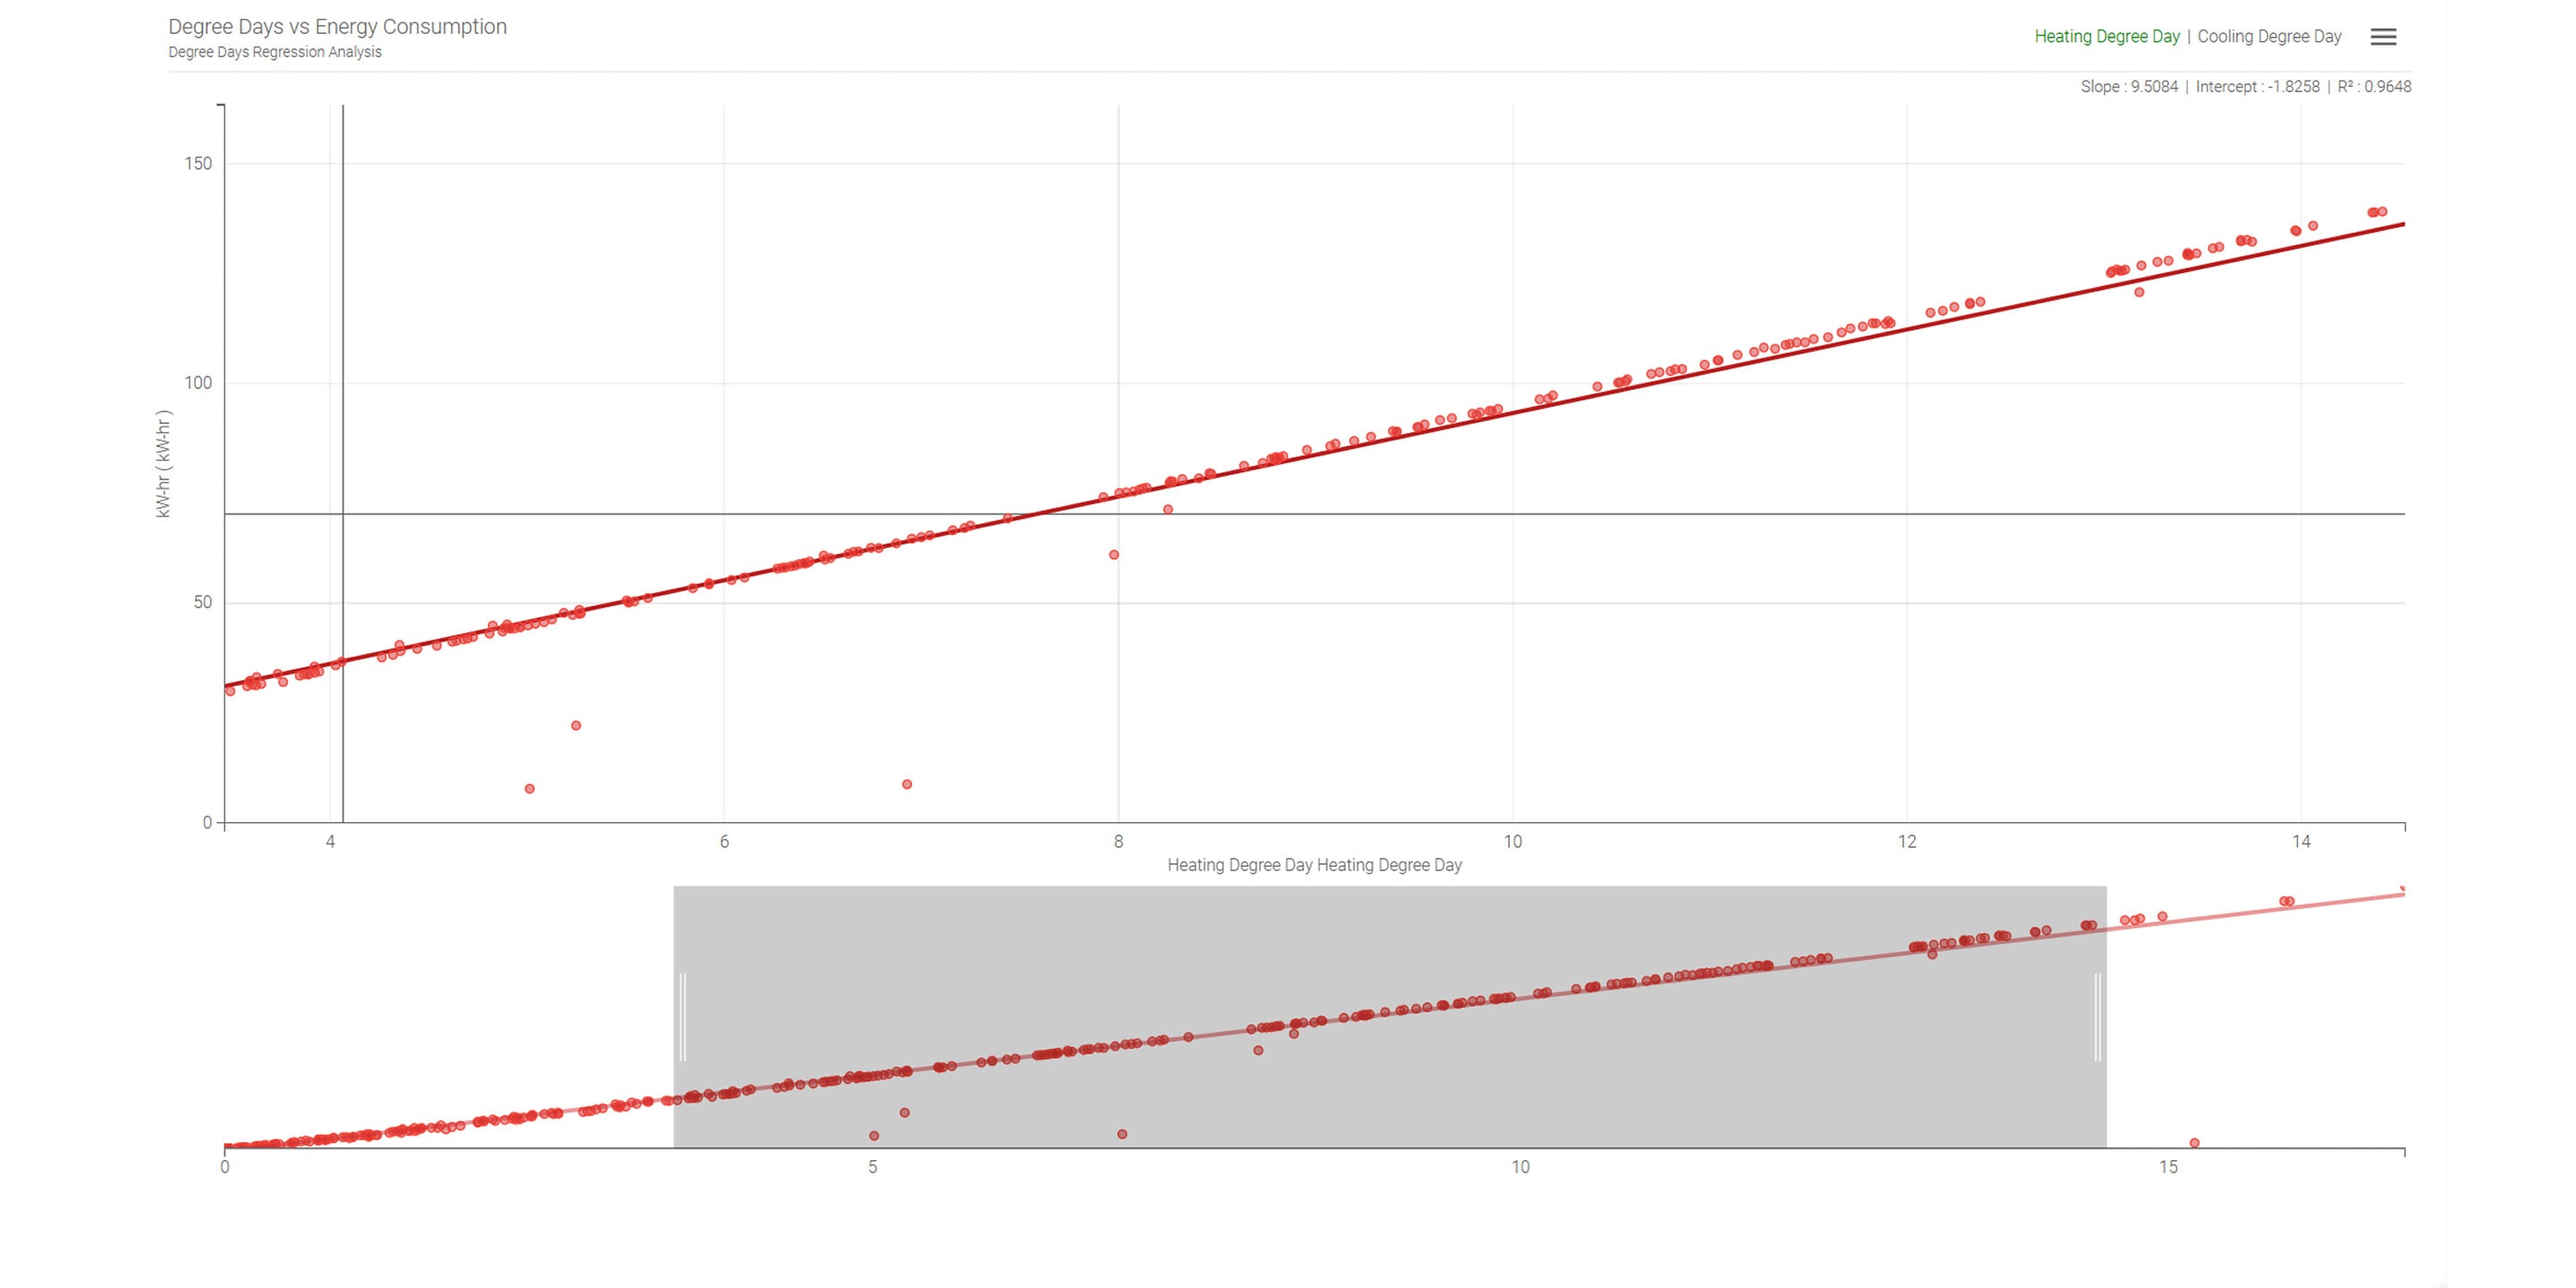
Regression analysis Show the relationship between weather data and the energy consumption of your buildings in a regression graph for heating, zero-energy and cooling periods, and compare the actual consumption with the predicted energy consumption. |
 |
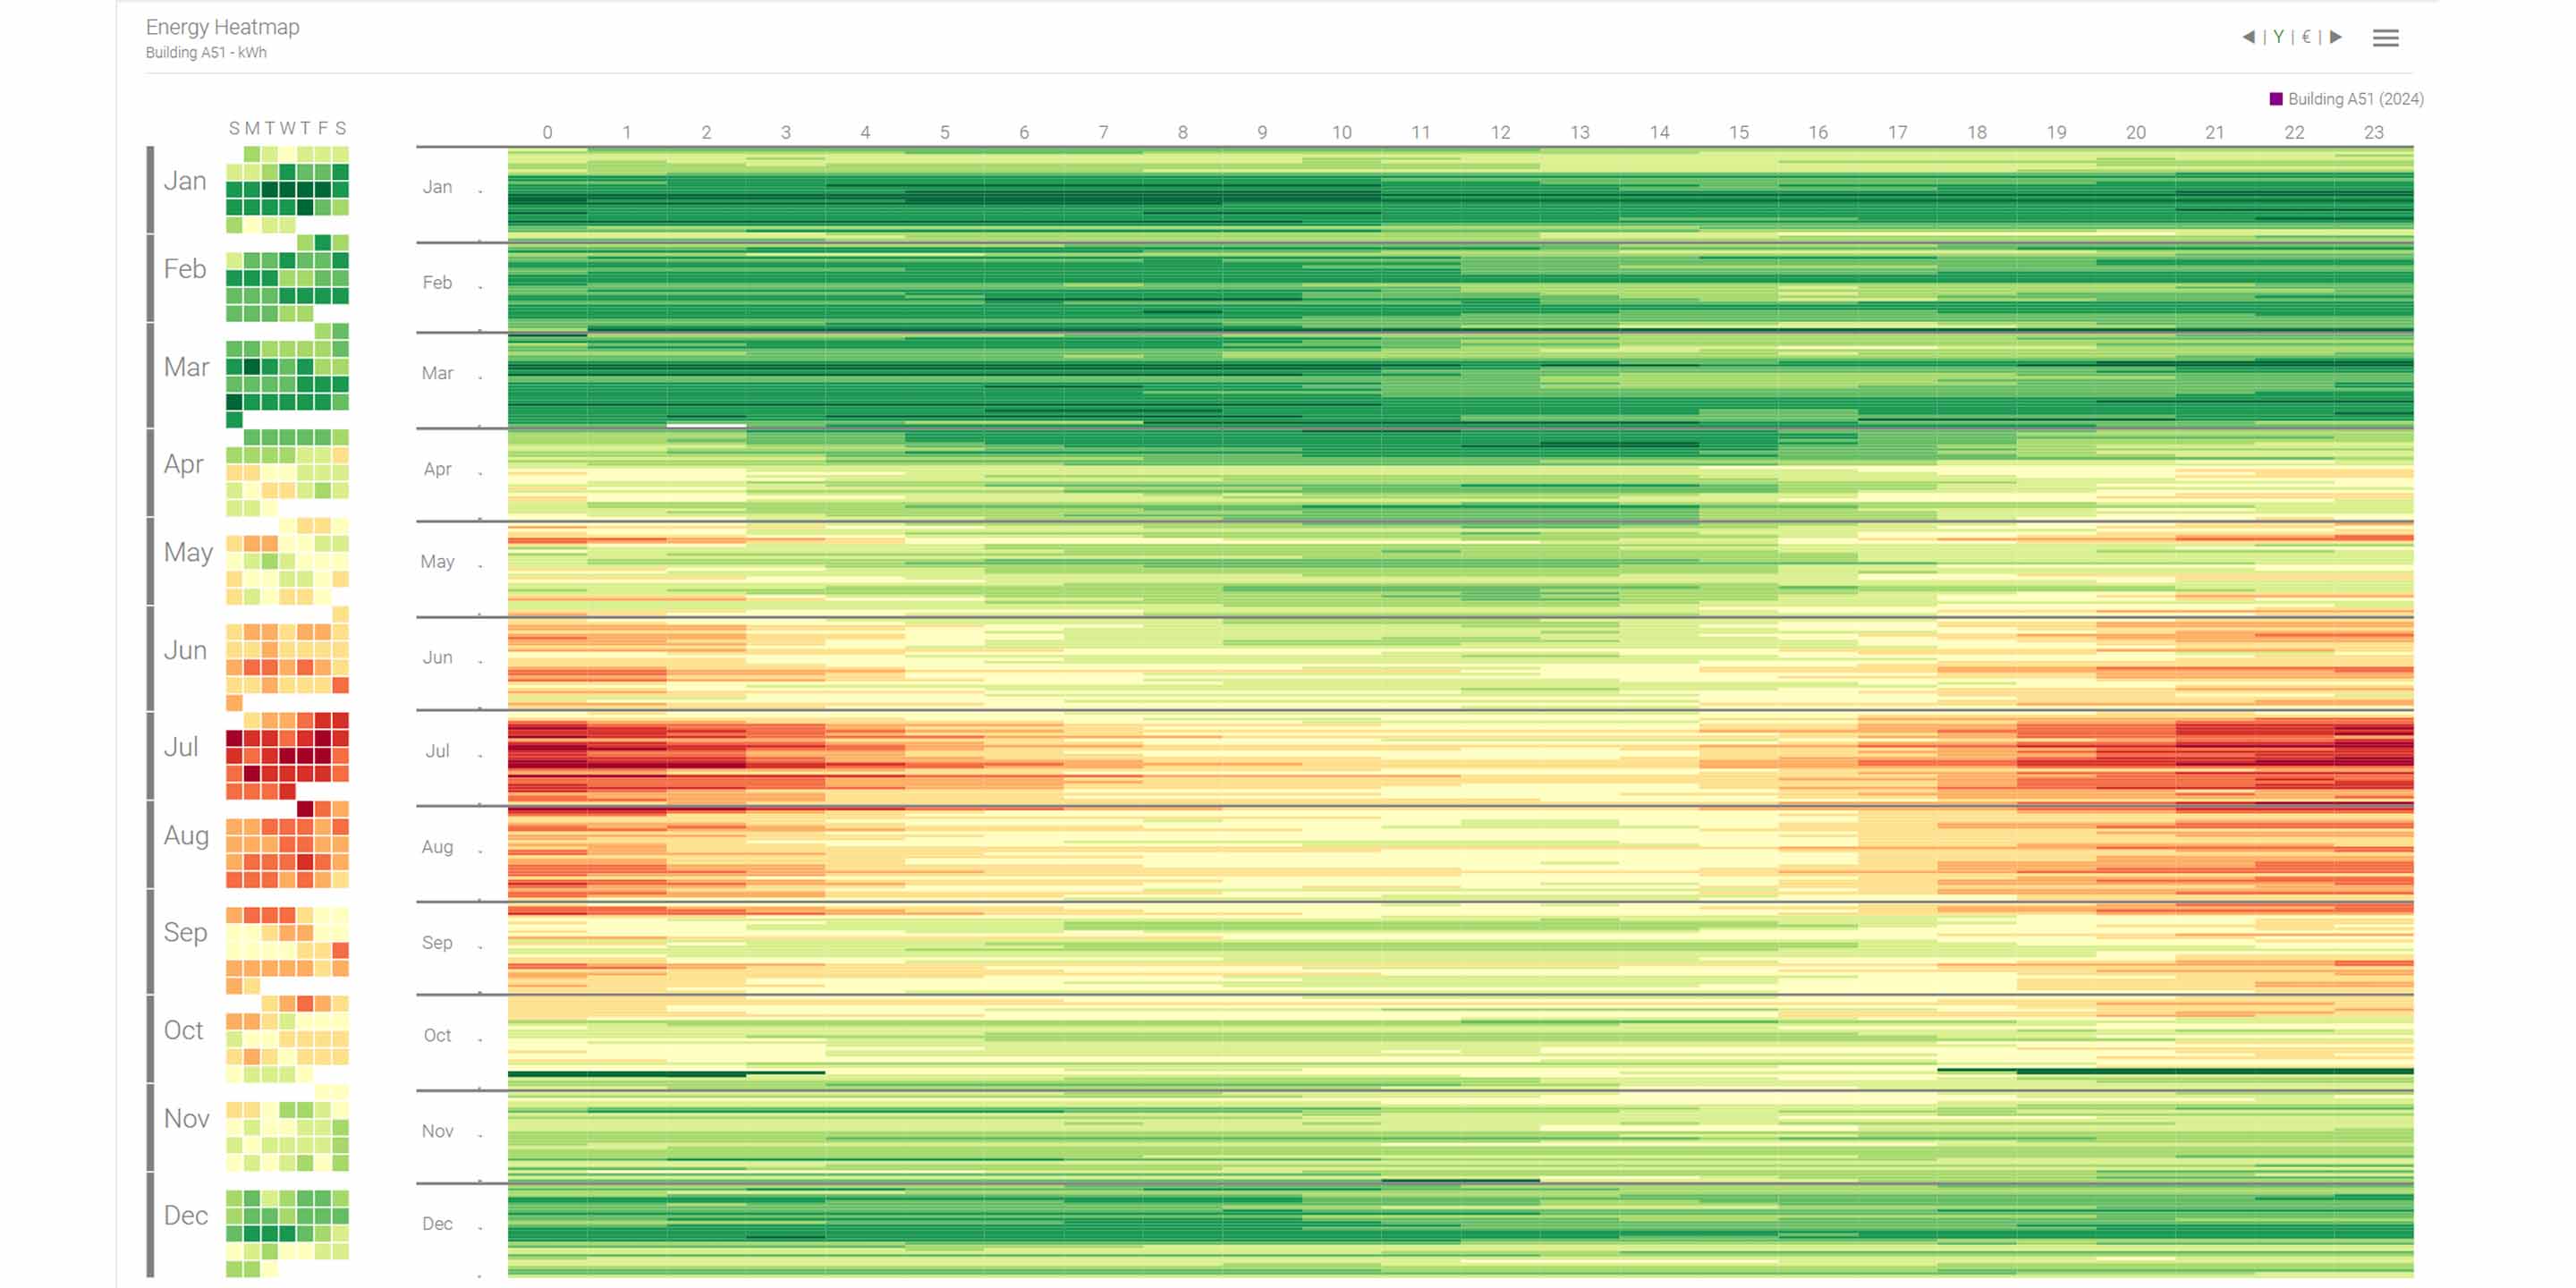 |
Heat map View your energy data in a heat map with coloured 1-hour blocks to identify outliers, trends and patterns throughout the year. The value ranges are calculated automatically based on the minimum and maximum values. |
Machine learning The Energy Manager uses the strengths of advanced AI and machine learning to revolutionise energy management in buildings. This innovative technology enables automated analysis and evaluation of energy consumption patterns and provides you with meaningful information without the need for complex configurations. |
Data integrity With our data integrity tool, you can easily recognise problems in the quality of your data. Get an overview of the overall integrity of your data at a glance across each chart with intuitive colour coding and helpful summaries in tooltips. Deepen your analysis by viewing the exact number of active and inactive meters for each data set within a selected time period in a separate data integrity pop-up window. |
Energy KPIs
Real-time energy KPIs with vector normalisation With vector normalisation, you can use one aggregator to normalise another to get more meaningful real-time energy KPIs. |
 |
Energy per degree day (kWh/DD) Measure the efficiency of your air conditioning system by comparing the energy consumption with degree day data. This allows you to recognise how energy consumption changes depending on the weather and to identify inefficiencies in the event of temperature fluctuations. |
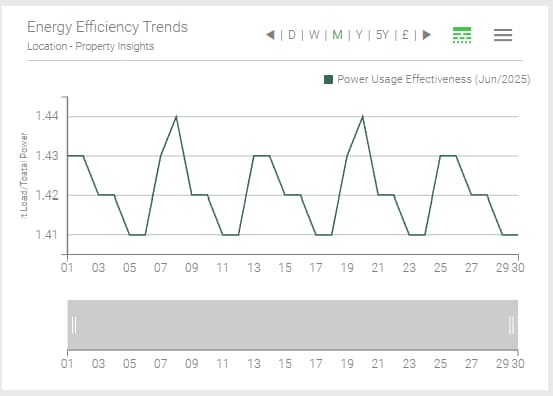
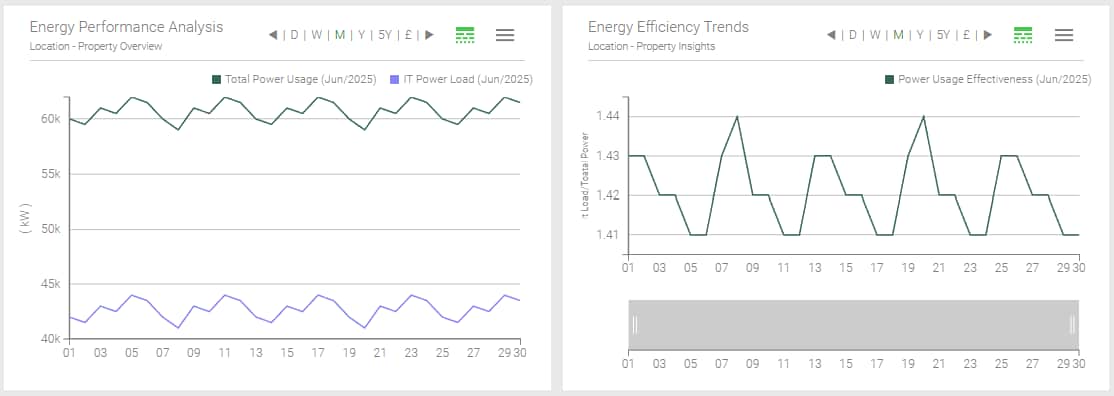
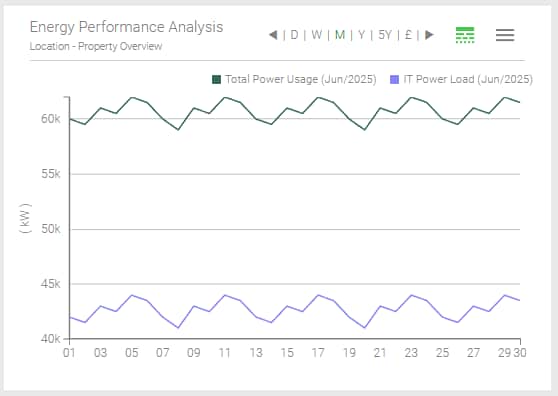
Historical PUE (Power Usage Effectiveness) Monitor the efficiency of your data centre as conditions change. With separate time series for the total energy consumption of the system and the IT load, you can now continuously calculate the PUE (total / IT). |
 |
Energy intensity in production Monitor the energy demand per production unit. By dividing energy consumption by production volume (e.g. kWh per kg), you get a live overview of operational efficiency, making it easier to recognise trends and reduce waste. |
 |
Reporting
- Export raw data
- Create reports and bills using Microsoft Excel templates
- Save automatic reports as CSV, PNG or PDF documents and send them by e-mail
Raw data export Export your raw energy data to Excel so that you can calculate KPIs (key performance indicators) or billing amounts using any mathematical methods, tariffs or reference tables. |
 |
Reporting Create reports or tenant statements using Microsoft Excel templates and generate PDF documents that you can automatically send by e-mail or print out. |
Automation Automatically generate reports in CSV, PNG or PDF format for each graph or chart, and configure the reporting tool in such a way that a PDF file is saved locally and sent by e-mail. |
Personalisation
- Design your own navigation menu
- Personalise the user interface for your project and branding
- Visualise energy consumption and peak demand for specific meter groups
- Customise reports and bills
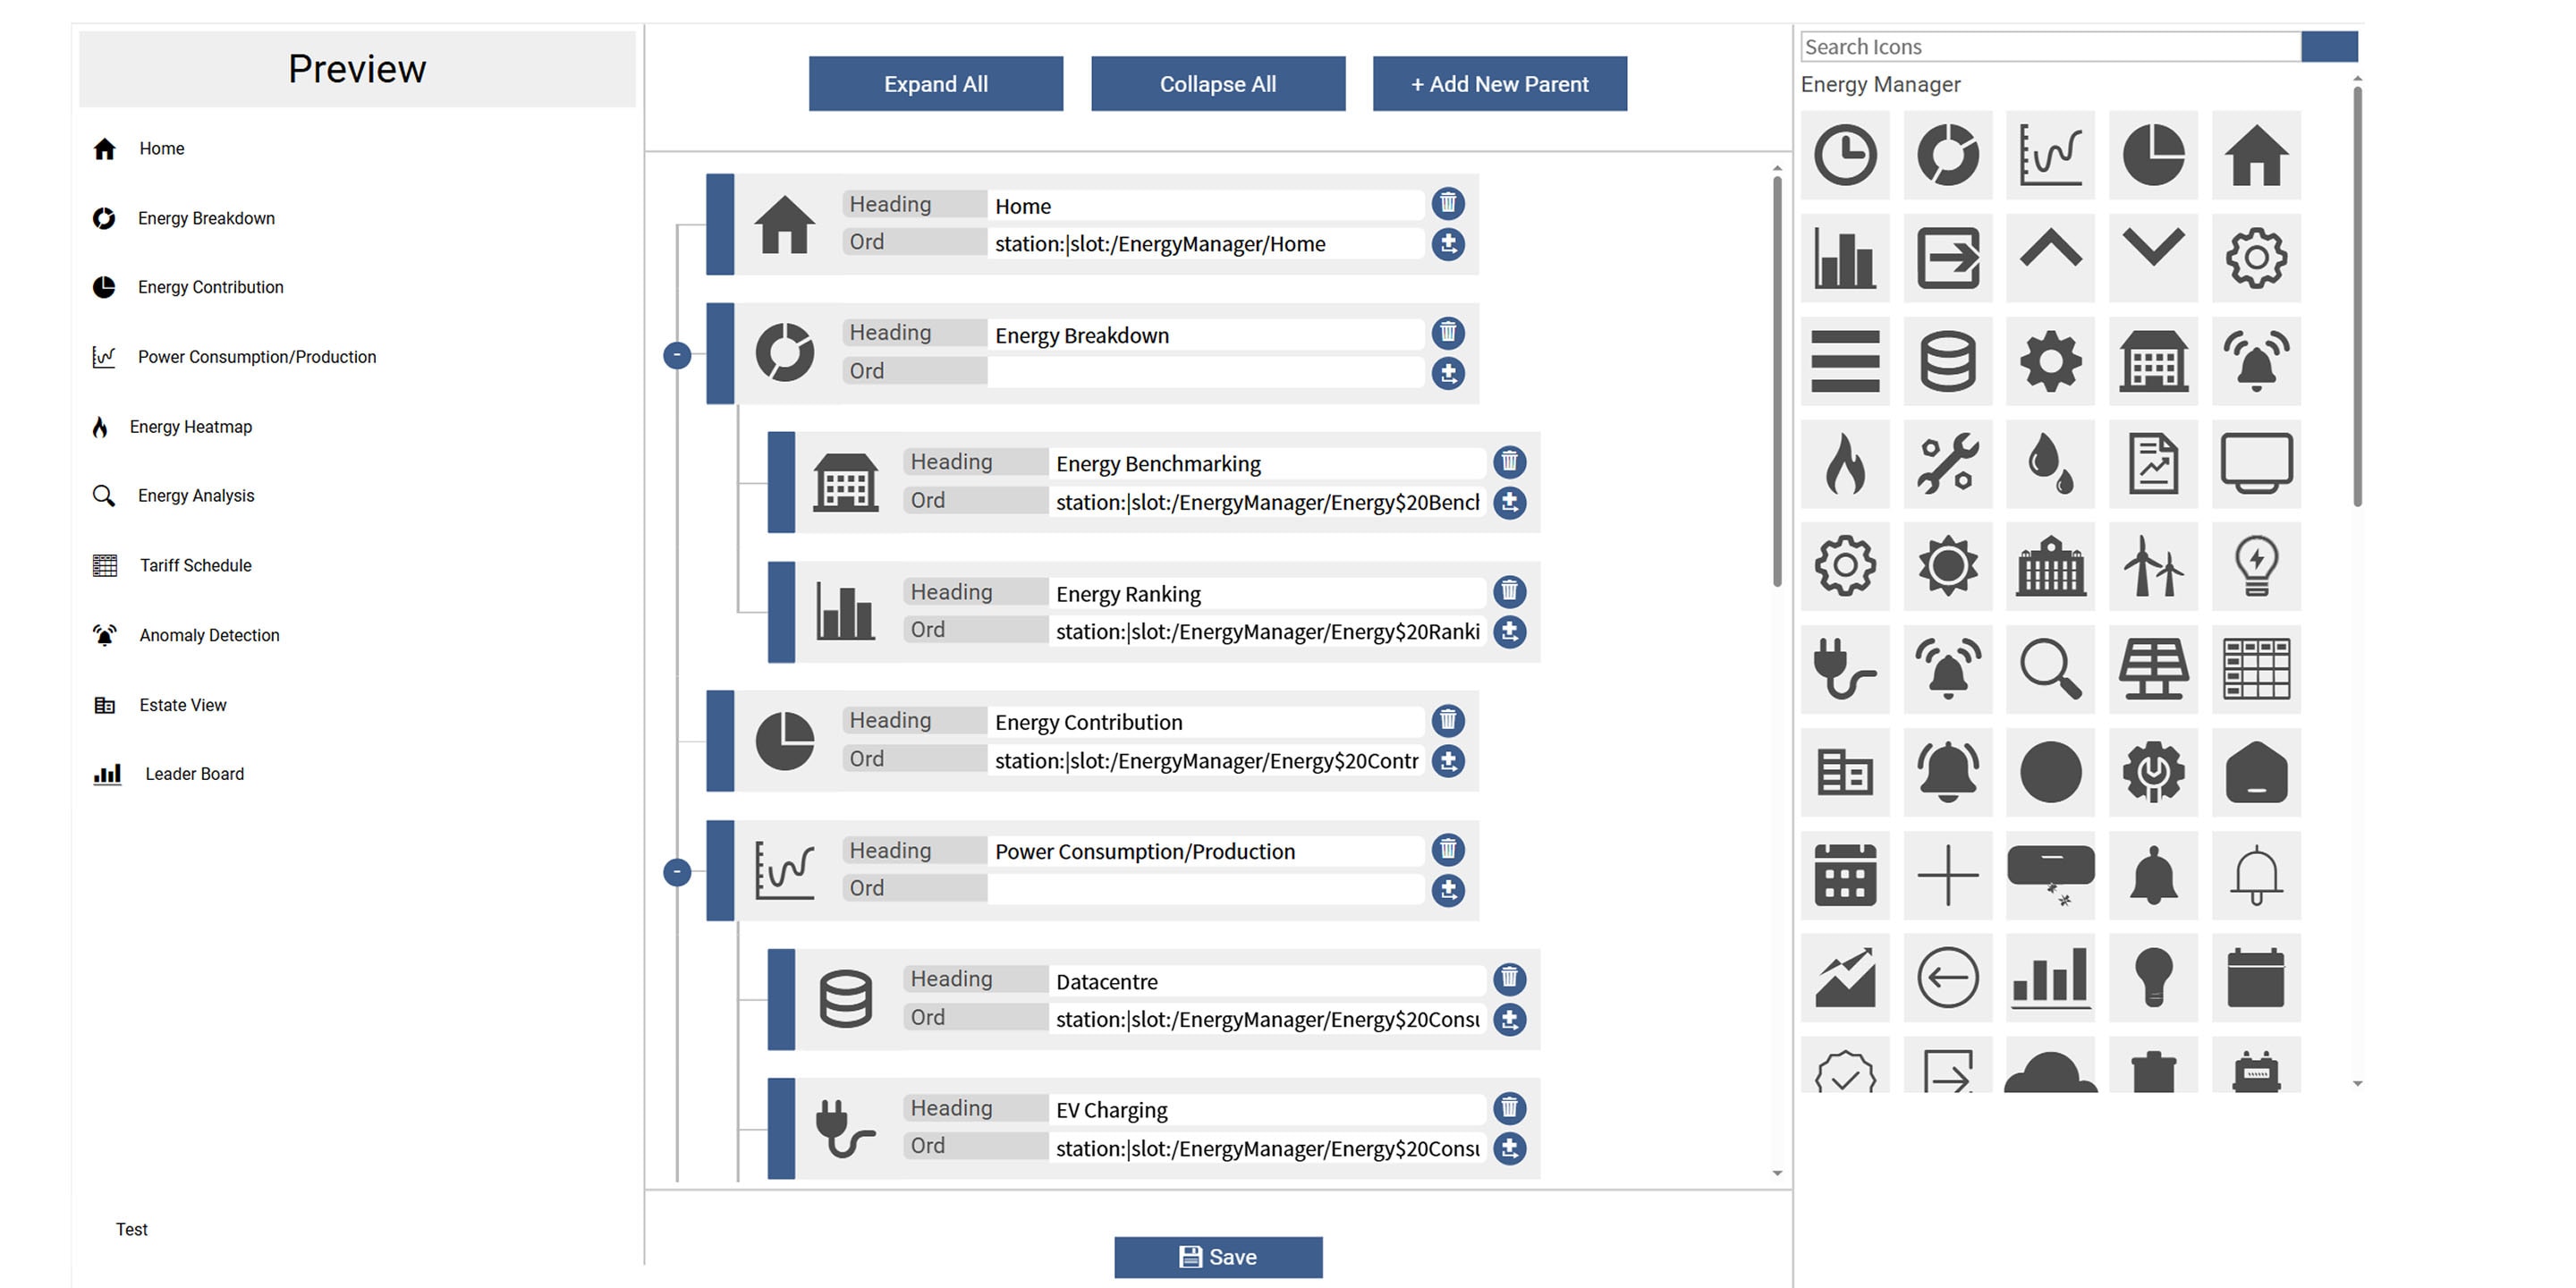
Customised menu Customise the vertical navigation menu in the Energy Manager dashboard to your personal requirements using the sophisticated and intuitive “Menu Builder” drag-and-drop widget – without any programming knowledge. The widget can be easily integrated into any Px page, ensuring a consistent navigation experience. |
 |
Customised user interface Create a customised user interface that is tailored to your project and your branding. You have access to a library of graphical charts, displays and widgets to design the pages you want with the content that is important to you. |
Grouping of meters Group and normalise multiple meters for a zone, location or building. This allows you to graphically display the energy consumption and peak demand over different time periods for a single meter or a group of sub-meters. |
Personalised reports and bills Customise your reports and bills, including logo, text, charts or images. |
Tools
- Involve employees and customers through public presentations
- Ensure the quality of your data
- Use historical weather data for precise consumption analyses
Kiosk mode for public presentations Show your buildings’ energy consumption along with your company news and public announcements at your building reception, in offices, meeting or break areas to increase employee participation in energy saving initiatives. The selection, sequence and display duration of the pages can be customised. |
 |
Data integrity Thanks to intuitive colour coding and helpful tooltips, the data integrity tool shows you at a glance if there are problems with the quality of your data. The overall integrity of your data is displayed as a percentage and a separate pop-up window allows you to view further details, such as the number of meters switched on and off within a specific time period. |
Weather service The Energy Manager integrates a comprehensive online weather data service that provides accurate historical weather information for the exact location of each individual system at no additional cost. This valuable data is combined with local energy consumption data, enabling the software to recognise anomalies with a high degree of precision. |
How Honeywell Optimizer Supervisor and Energy Manager can help you implement the 2024 Building Energy Act (Gebäudeenergiegesetz GEG)
Global climate change is a major challenge and the building sector plays a key role in this: In the EU alone, buildings are responsible for roughly 40% of energy consumption and 36% of carbon emissions. Commercial buildings should therefore become climate neutral by 2045, as required by the new Building Energy Act (GEG 2024). However, achieving this urgently needed climate neutrality requires innovative solutions in the areas of building automation and energy monitoring – two of Honeywell’s core competences.
Your obligations under GEG 2024 |
Our solutions for energy-efficient automation |
|
| Building automation You need to implement a building automation system that fulfils automation level B in accordance with DIN V 18599-11: 2018-09 or better. |
Honeywell Optimizer Supervisor This provides you with a scalable complete solution for managing buildings and other infrastructures, combining visualisation, interaction, monitoring and reporting. |
|
| Energy monitoring You have to monitor, analyse and log the consumption data of all technical building systems in order to identify efficiency losses and increase the overall energy efficiency of the building. |
Energy Manager The Energy Manager add-on allows you to record, visualise, analyse and optimise energy consumption across all trades for energy monitoring in accordance with DIN ISO 50001. |